
This data has been collected from hundreds of matches posted to YouTube over a three-year period 2022-2024 using video analysis software.
Player Level 3.0-3.5
General Game Data Averages
(Games played to 11 points, win by 2 points)
| Game Duration (minutes) | 15.4 |
| Rallies won by Serving Team | 48.8% |
| Rallies won by Receiving Team | 51.2% |
| Average Number of Rallies per Game | 28.7 |
| Average Number of Shots per Game (4 players total) | 166.0 |
| Average Number of Shots per Rally (4 players total) | 5.8 |
| Average Number of Shots per Player per Game | 41.5 |
| Average Number of Shots per Player per Rally | 1.4 |
How Do All Rallies End
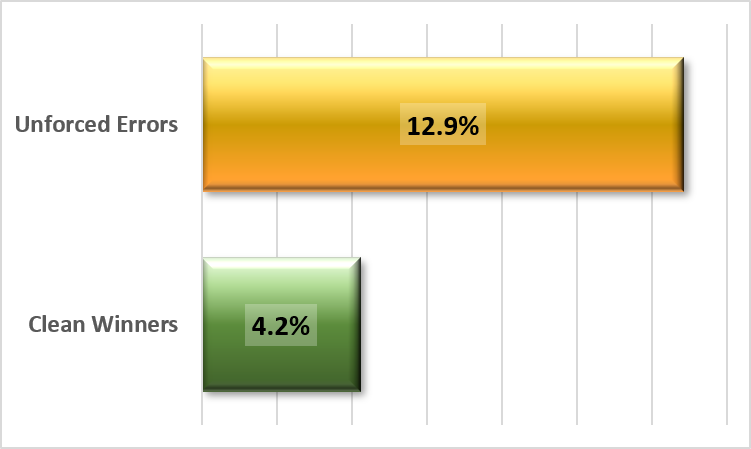
Shots by Shot Type per Game
| Shots by Shot Types | Per Player | Pct. of All Shots | Pct. of All Clean Winners | Pct. of All Unforced Errors |
| Serve | 7.1 | 17% | 4.8% | 3.1% |
| Drive (includes serve returns) | 18.8 | 45% | 9.5% | 53.1% |
| Reset | 1.7 | 4% | 0.0% | 7.8% |
| Lob | 0.8 | 2% | 0.0% | 3.1% |
| Volley | 11.0 | 27% | 71.4% | 29.7% |
| Overhead | 0.6 | 1% | 14.3% | 1.6% |
| Dink | 1.6 | 4% | 0.0% | 3.1% |
| Erne | 0.0 | 0% | 0.0% | 0.0% |
| ATP | 0.0 | 0% | 0.0% | 0.0% |
Drives vs. Volleys
Should players stay back and hit drives, or should they come to the kitchen line to hit volleys?
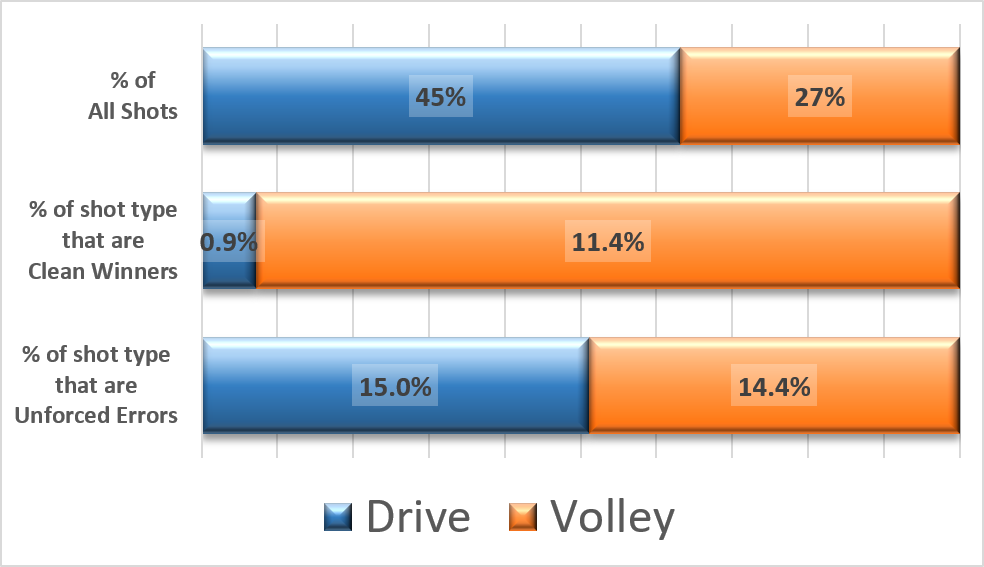
Players hit 1.6X more drives than volleys during an average game. Players hit roughly an equal number of unforced errors from drives as they do from volleys (15% vs. 14.4%); however, a player is 12.6X more likely to hit a clean winner from a volley than from a drive (0.9% vs. 11.4%).
Where Do Players Hit the Ball?
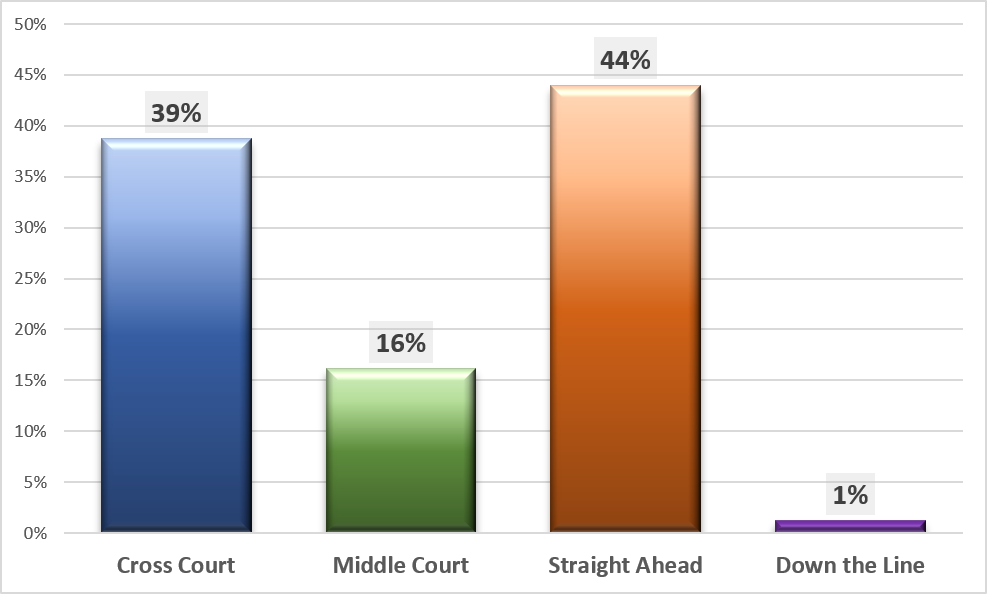
Depth of Serves
How often does the server win the rally based on the depth of the serve?
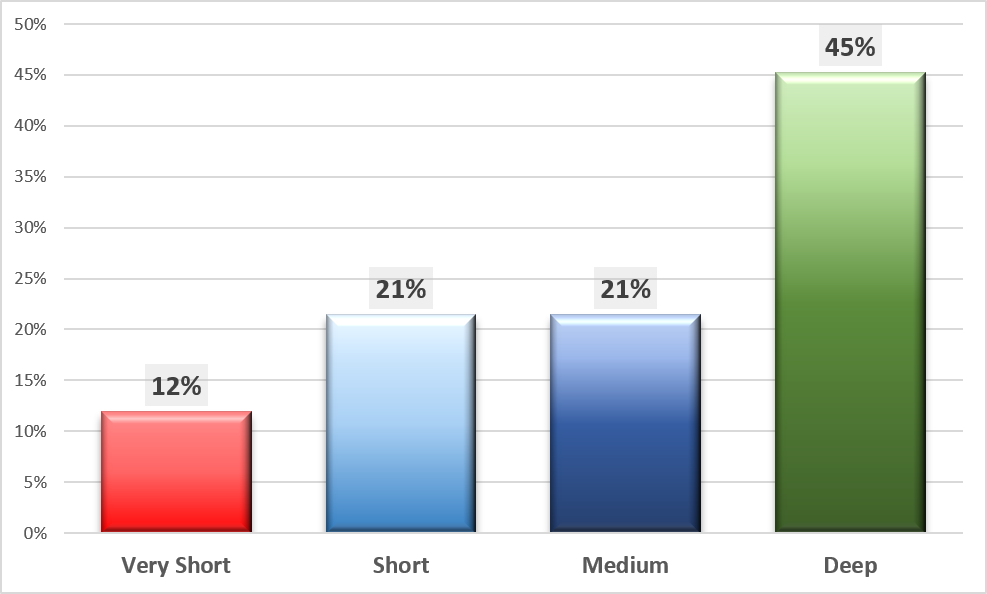
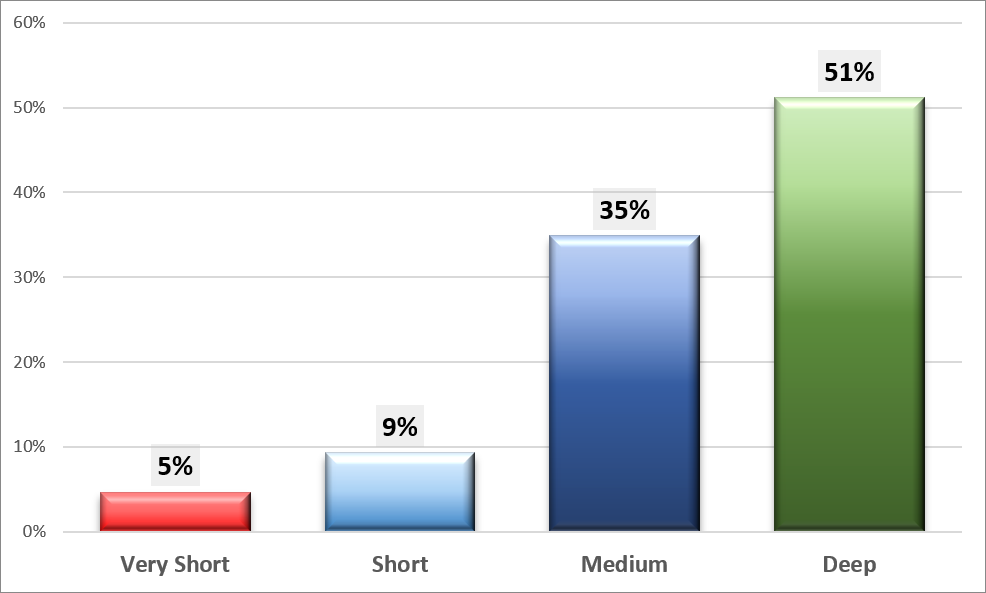
Depth of Serve Returns
How often does the receiver win the rally based on the depth of the serve return?
Playing vs. Drilling
If a player drills and hits a ball every 6 seconds (10 balls per minute), how many more balls will a player hit by drilling compared to playing an average game?
| Drives (includes serve returns) | 8X |
| Resets | 92X |
| Lobs | 205X |
| Volleys | 14X |
| Overheads | 264X |
| Dink | 97X |